Viewing data
There are two pages available for viewing data from devices - chart and table views. These views can be accessed via links in Devices and Series groups pages.
Both of views queries databases to get data for series assigned to groups. Then they put it respectively on the chart or in the table. In case of the former one (chart) it will also listen for incoming messages over MQTT.
It is necessary to select some series as active for device. Otherwise chart and table views won't work and also links pointing to them will be disabled.
Chart
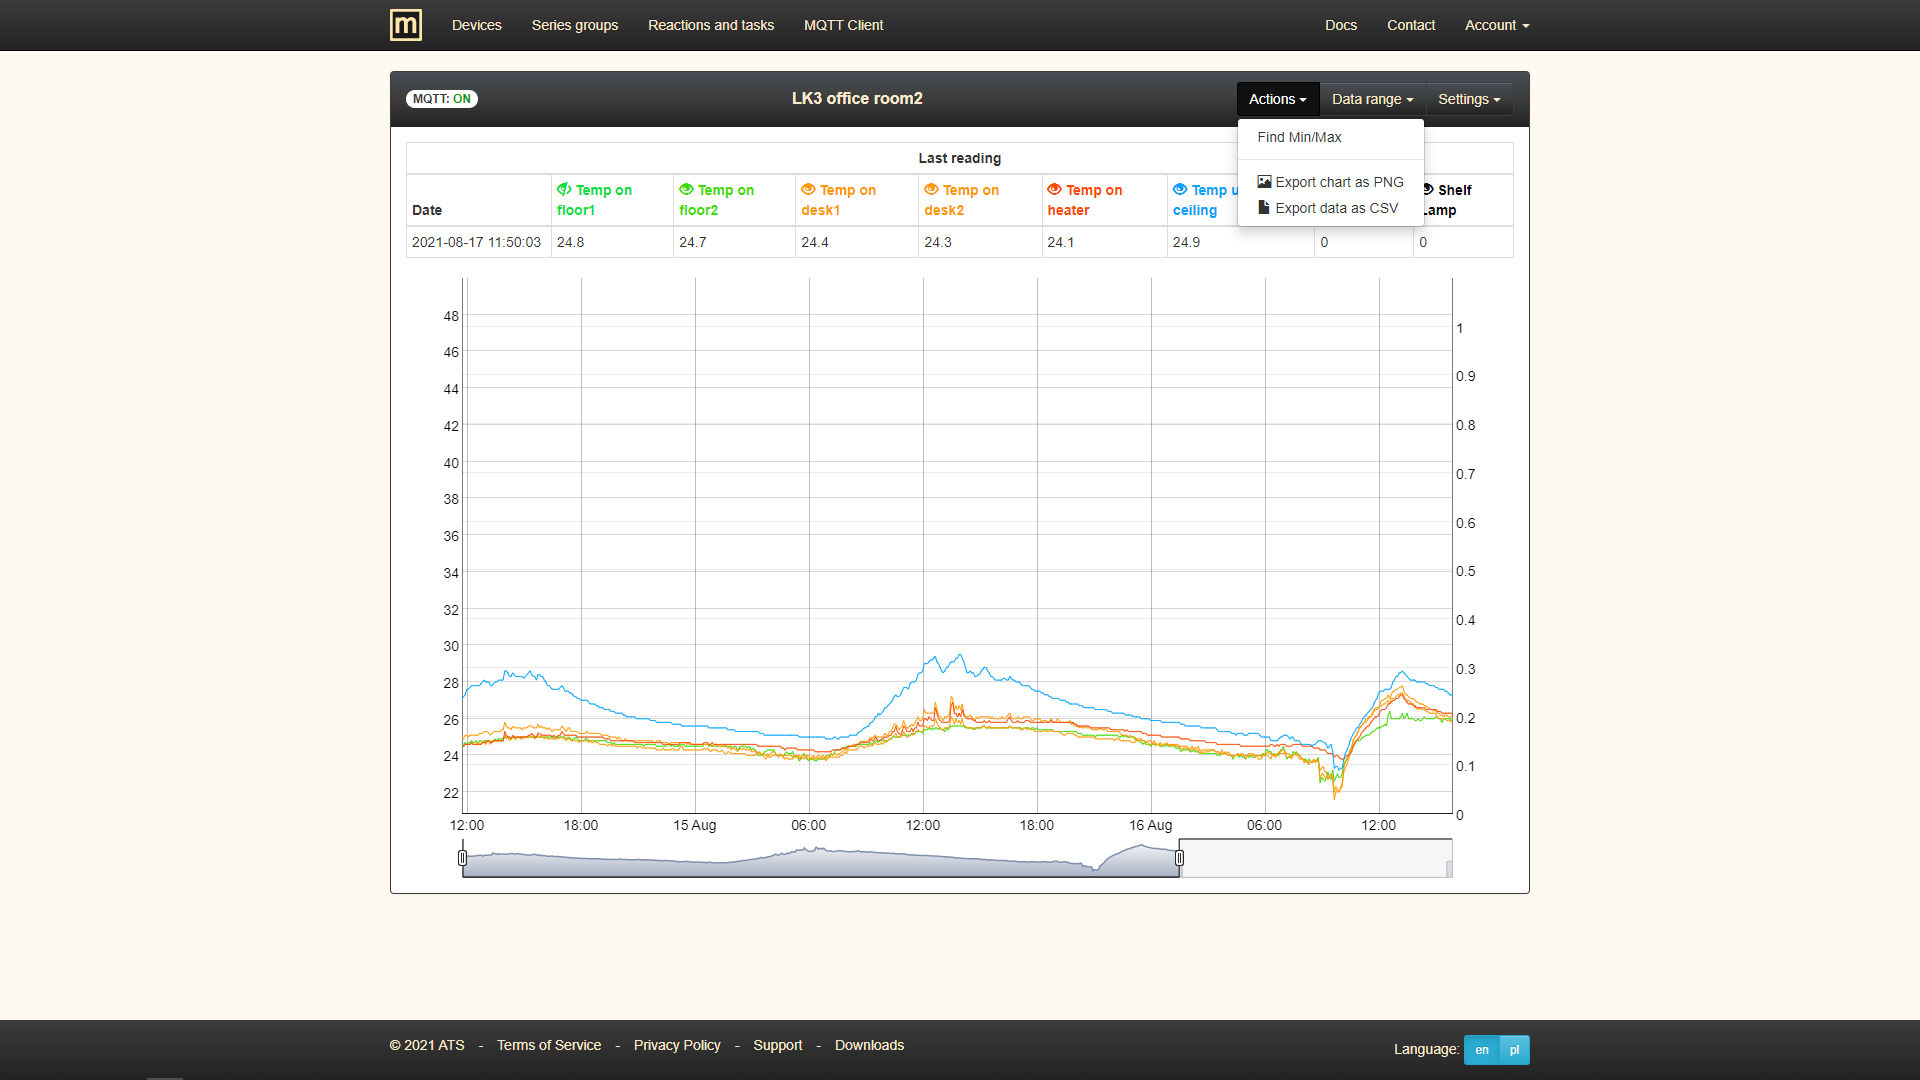
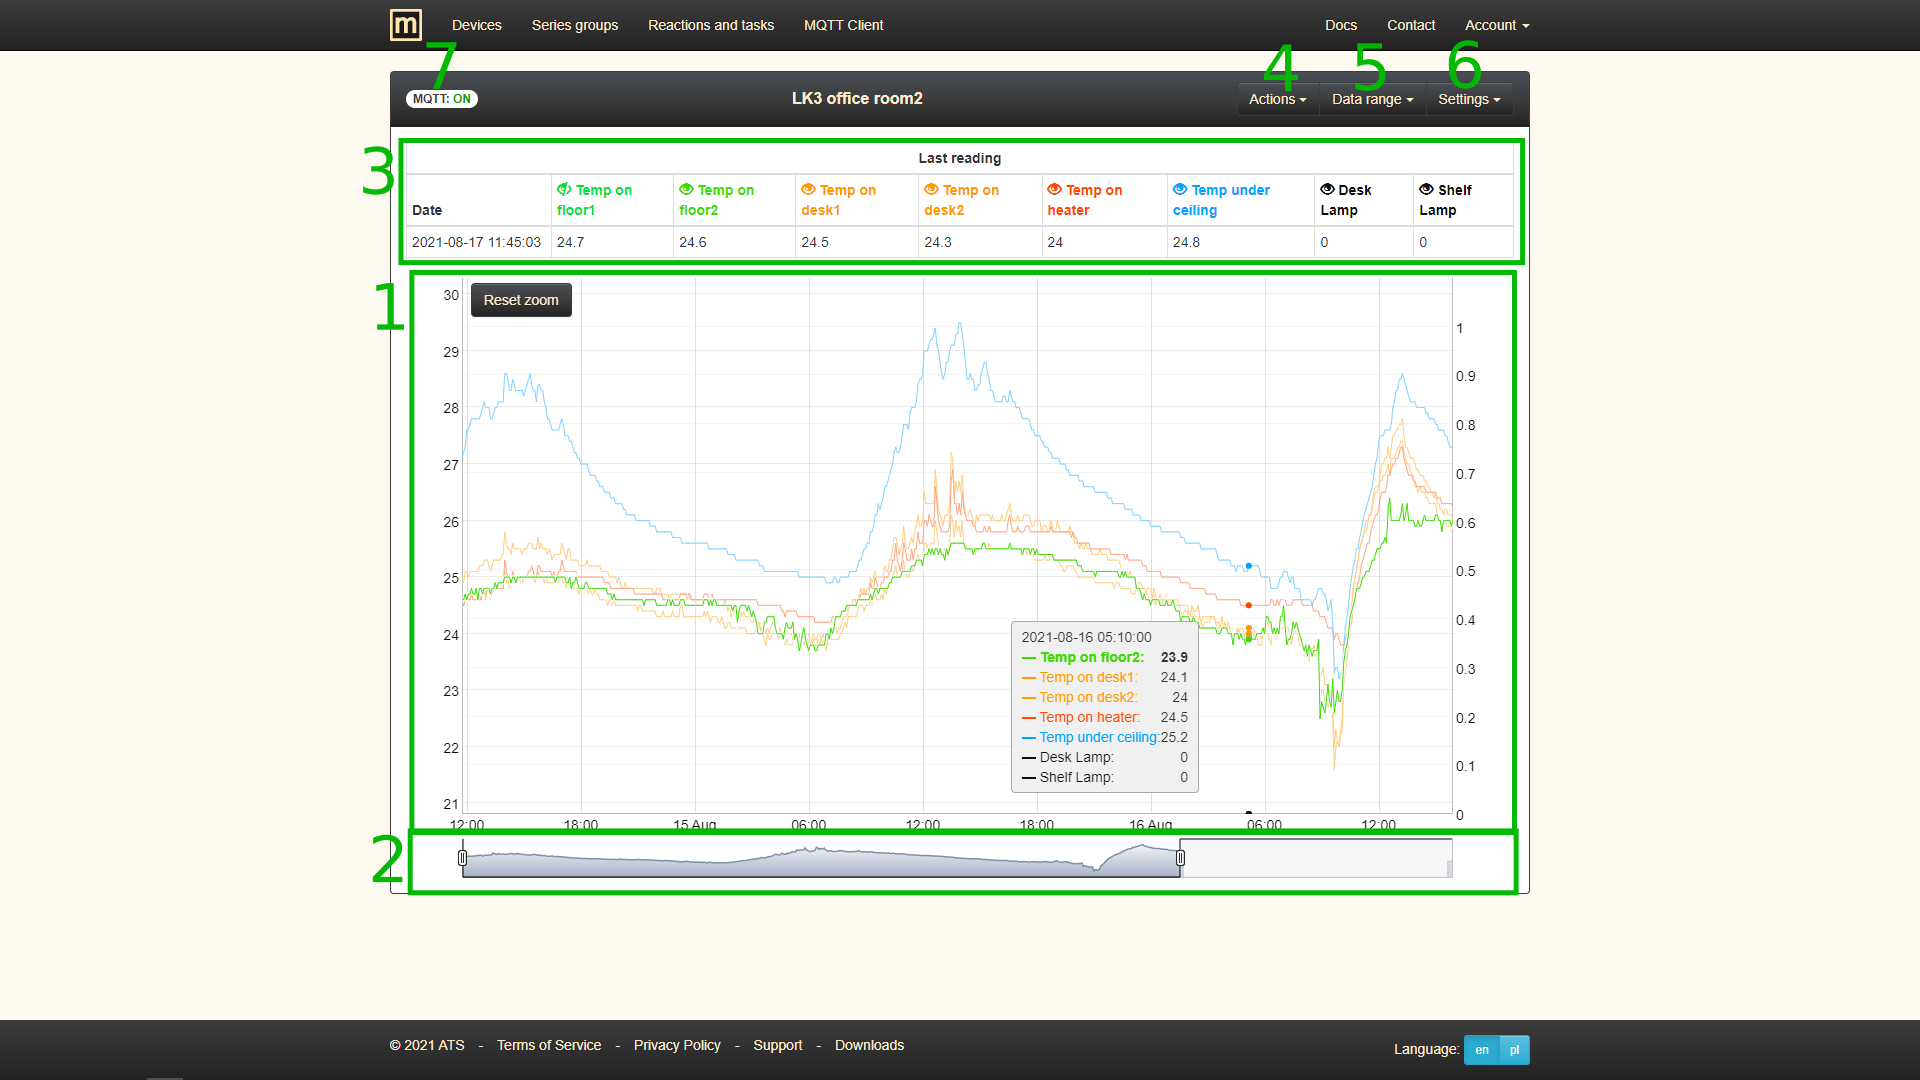
The chart page consists of several important elements:
- The main element, the chart itself. When you move the cursor over it, a panel will be displayed next to its position with the readings for the indicated measurement point.
- Slider for changing the visible range of data. A button to reset the zoom will appear in the upper left corner of the graph, when the display range is smaller than the default one.
- Table with recent readings. Initially supplemented with data read from databases, and later updated with data from MQTT.
- Chart actions (formerly Chart functions), such as finding the minimum and maximum for a series, exporting data to a PNG file (image of the currently displayed chart, with selected zoom) or CSV (data read from databases with the date in ISO-8601
YYYY-MM-DDTHH:mm:ss.sssZand separator;). Image of this item. - Data range (previously included in the Chart functions section) - allows you to download a different data range without changing the default data download period in the series group settings.
- Settings.
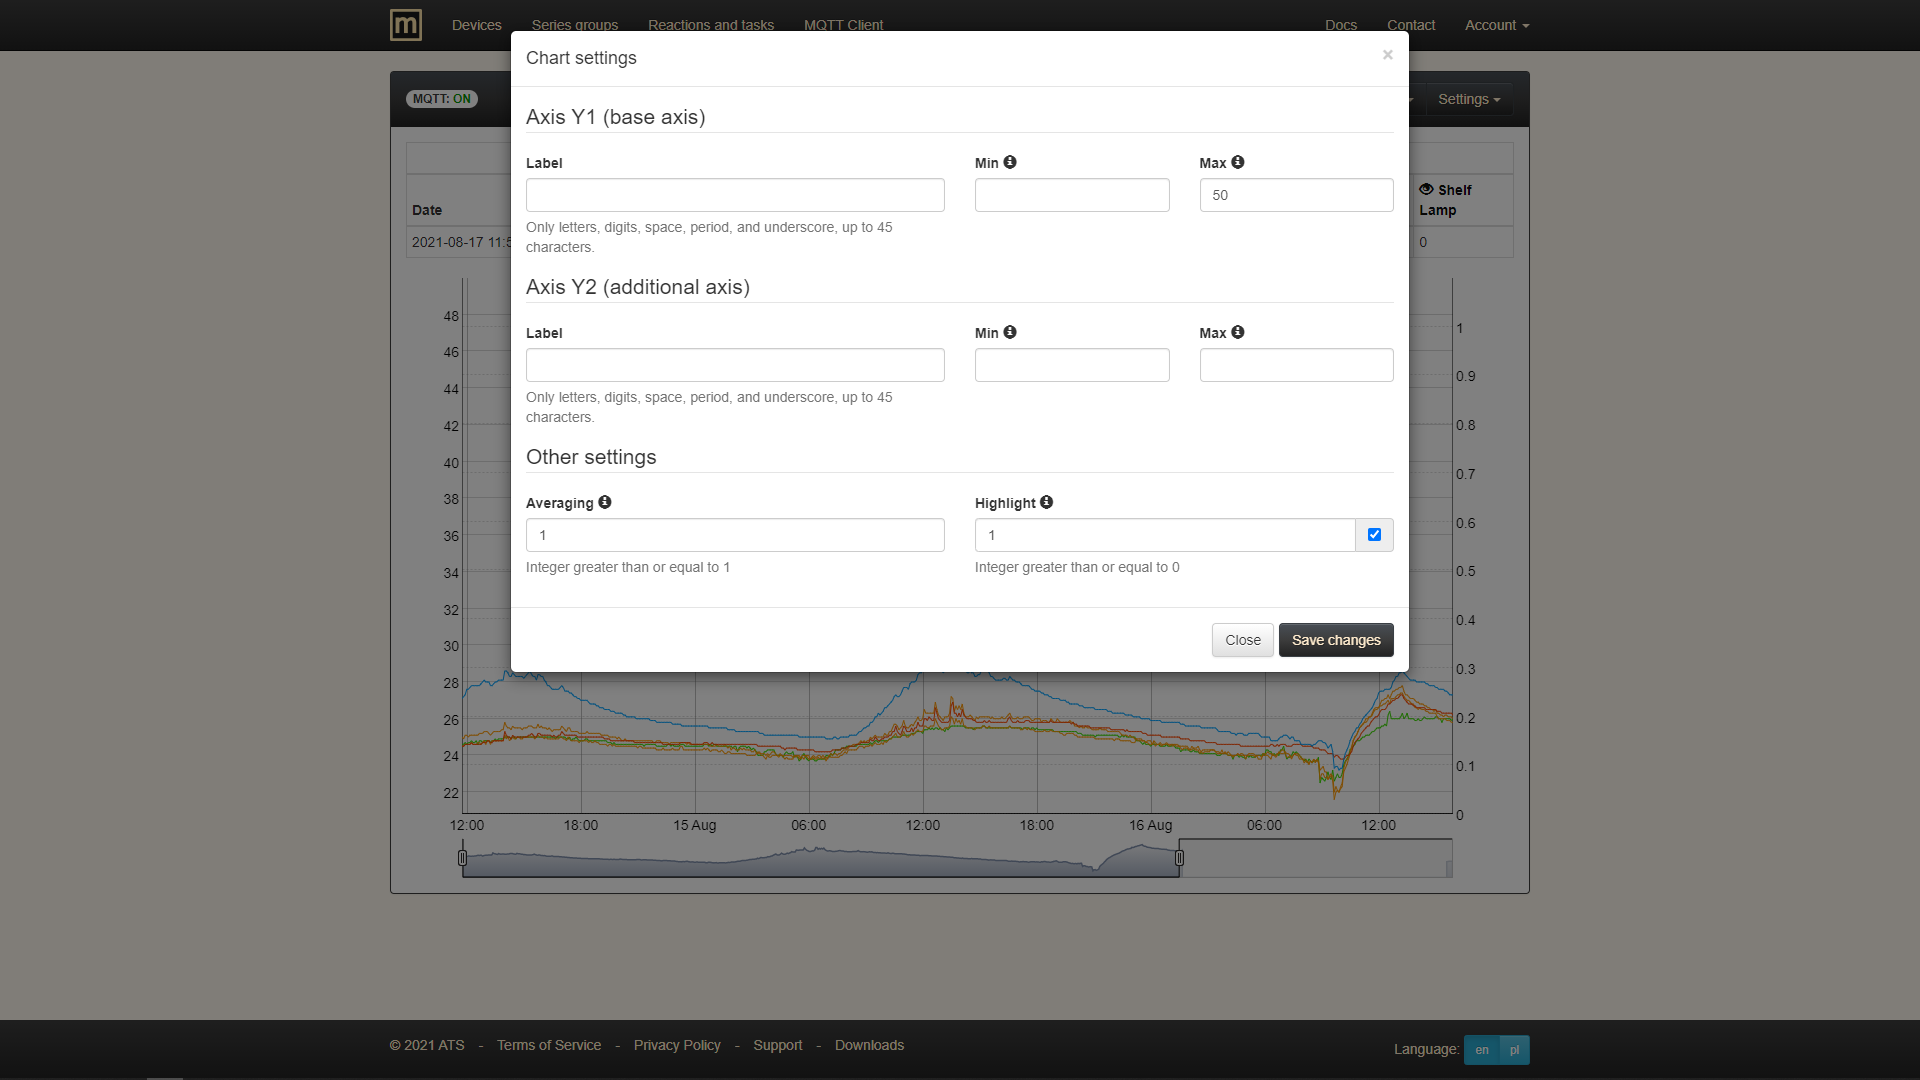
- Chart settings - options that affect the entire chart, such as axis labels, axis ranges, averaging, highlighting series on hover. Image of this section.
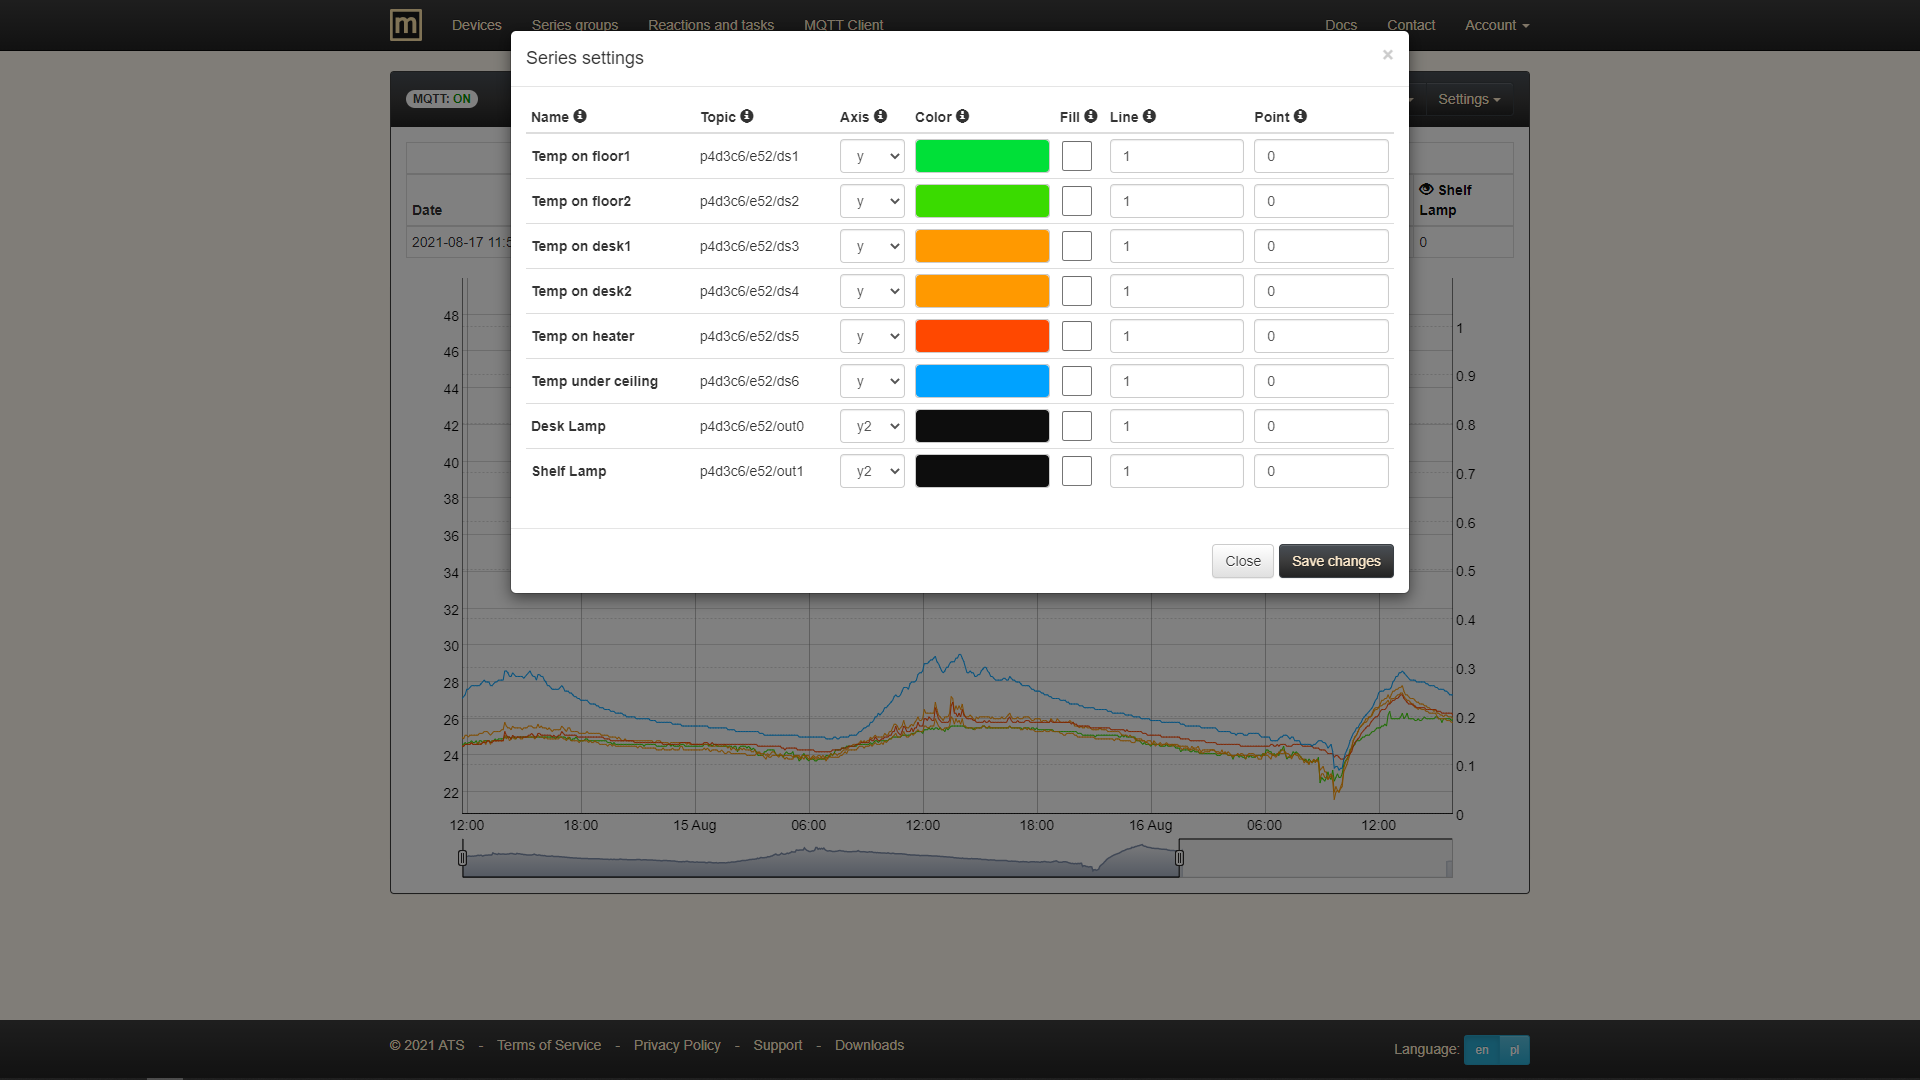
- Series settings - options related to the appearance of the series on the chart (axis assignment, color, filling below the series line, line width, data point size). Image of this section.
- MQTT connection status.
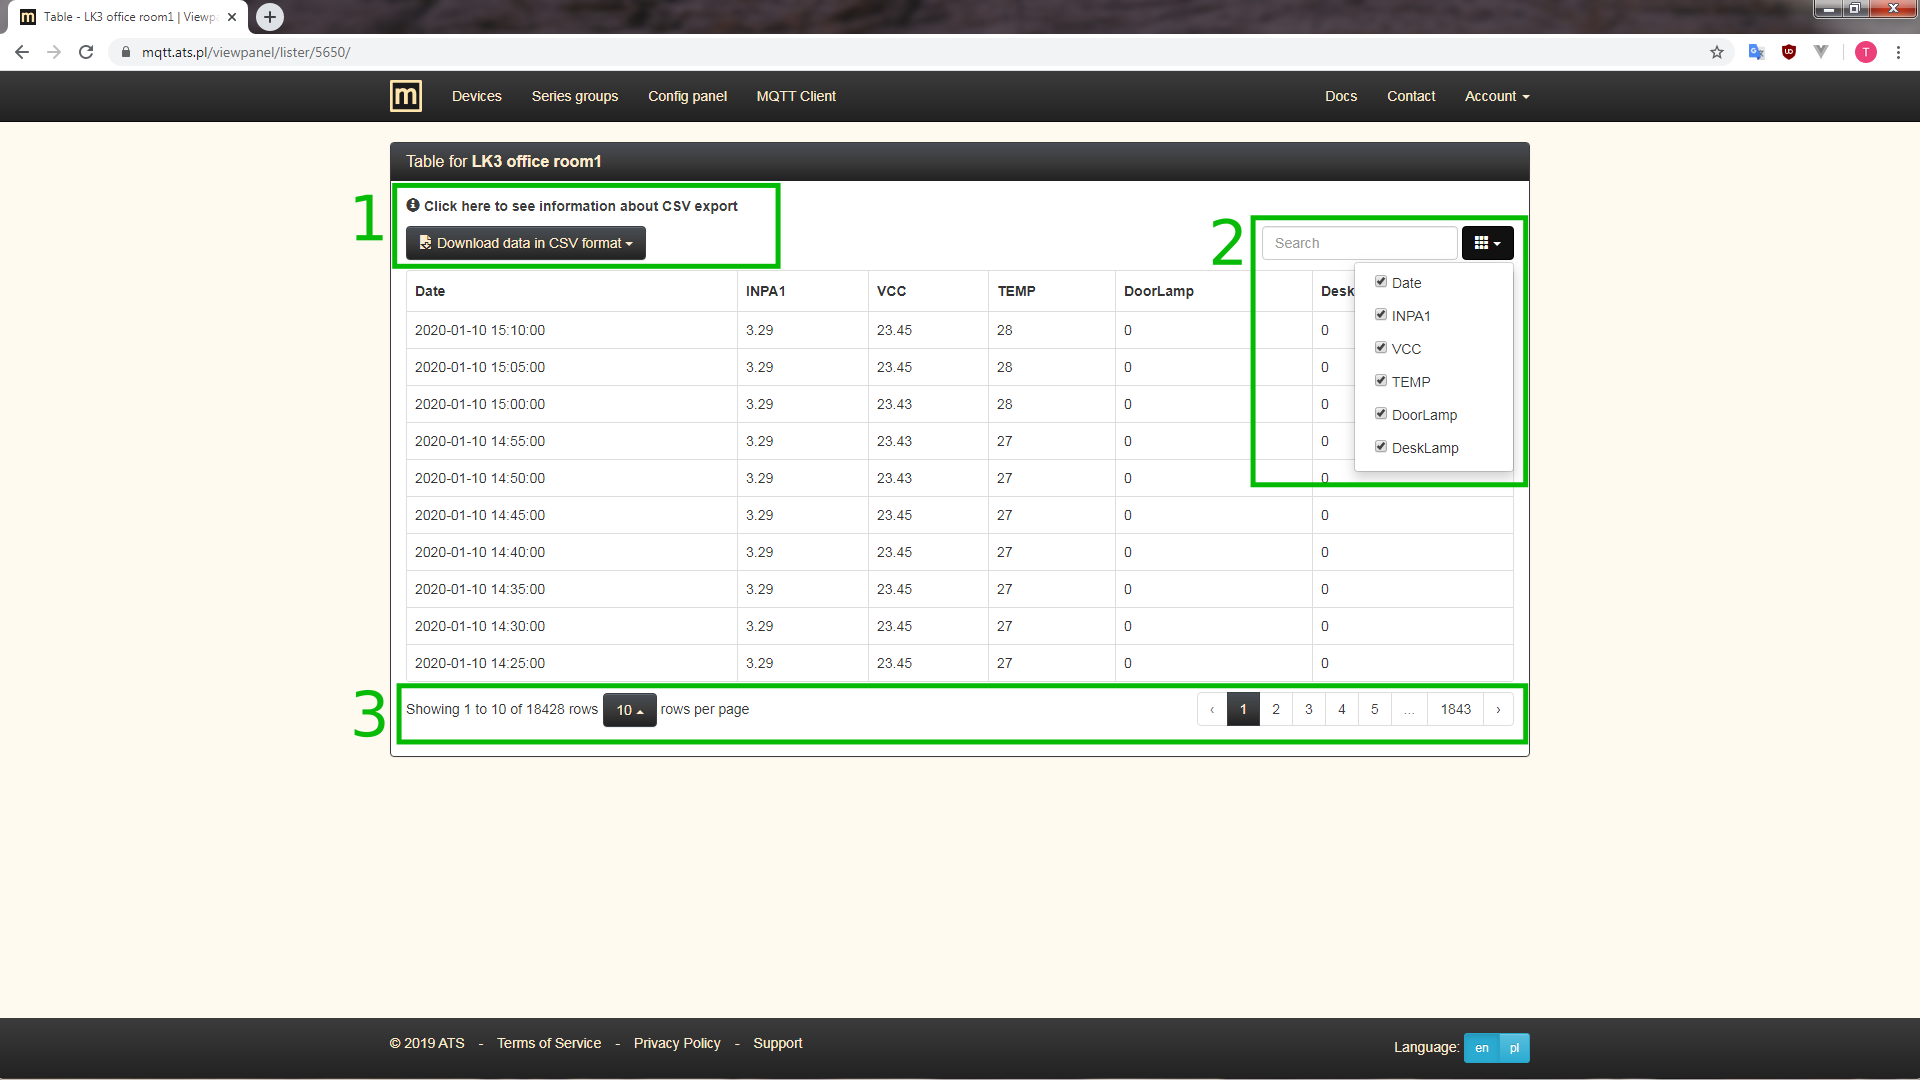
Table
In the centre of Table page there is said table with date and series values. There also are few other parts that should be distinguished.
- Download data in form of CSV file. There are few options of how date is formatted in file.
- Search field which scans dates and series values that can be used to filter results. You can also quickly choose which series should be visible.
- Navigation line where you can choose number of displayed results on page and move across pages.